PowerBI Dashboard: Movie Dataset
About the project
This project aims to create an interactive multi-page PowerBI dashboard using the movie data extracted from themoviedb's API endpoint.
Project Goals
1. Data Collection:
- The movie data was collected from themoviedb's API endpoint. You can find the documentation for the API here.2. Perform feature engineering
- This step involves creating new columns such as profits, ROI, year and day columns to enrich the dataset.3. Create the PowerBI dashboard:
- Load the dataset into PowerBI and create an interactive multi-page PowerBI dashboard.About the Dataset
The data extracted from themoviedb consists of the top 500 US-affiliated movies of each year, ranging from 2010 to 2022, and it is collected based on the vote counts from themoviedb.
PowerBI Dashboard Overview:
The dashboard contains 4 pages:
PowerBI Dashboard Features:
Features added to make the Dashboard more interactive and user-friendly:
Dashboard showcase:
- # Main Page:
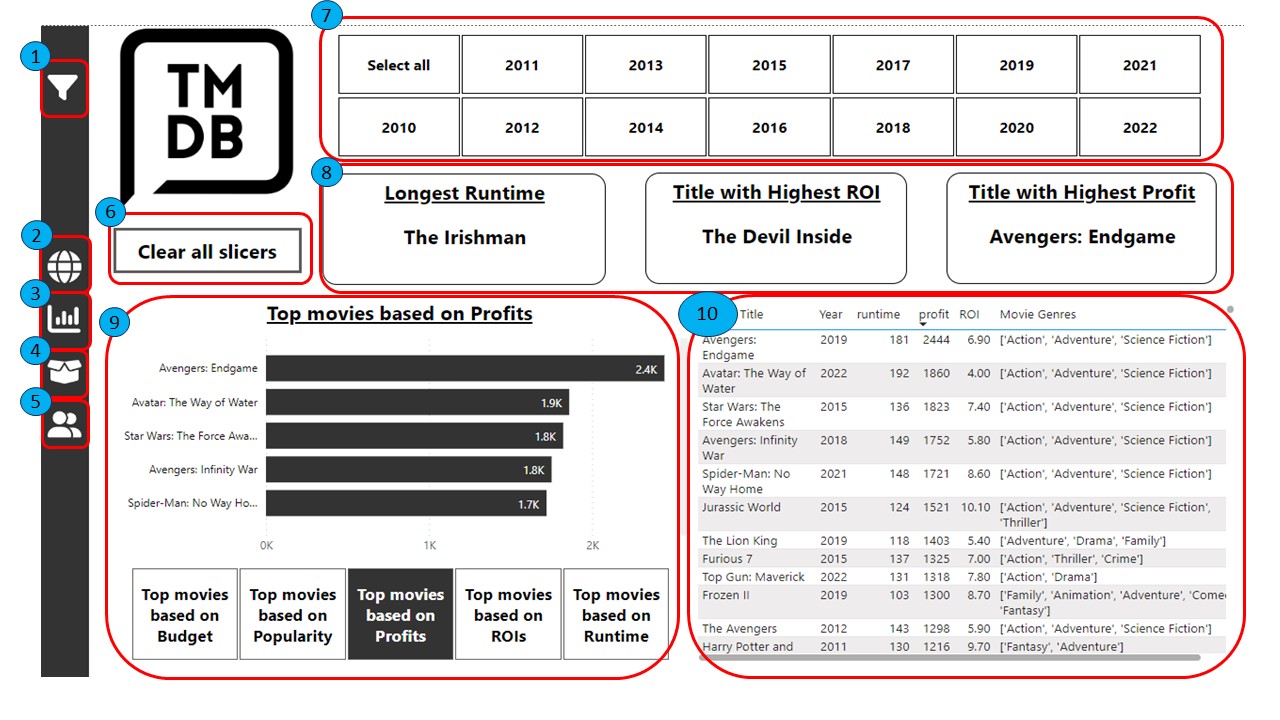
Dashboard description:
| Number | Description |
|---|---|
| 1 | Genre Filter button |
| 2 | Main Page navigation button |
| 3 | Graph Page Navigation |
| 4 | Movie Details Page Navigation |
| 5 | Key Influencers Page Navigation |
| 6 | Clear Slicer Settings |
| 7 | Year Slicer |
| 8 | Cards showing titles with Longest run-time, Highest ROI and Highest Profit |
| 9 | Bar Plot (based on selected metric) |
| 10 | Movie Information Table |
Download the Dashboard (pbix format)
Check out my Github Repository for more info:
View on GithubChat Assistant
Hi! How can I help you today?